Case study: client work, in progress
Canyon State
Reporting software for an independent Arizona insurance agency that shows which referral partners are worth a sales rep's time, replacing a 38-column spreadsheet nobody could read.
- Client
- Canyon State, an independent insurance agency in Arizona
- Role
- Discovery in the office, product, design and build, with the sales team
- Stack
- Vue 3, TypeScript (strict), Vite, Pinia, Tailwind 4, AG Grid, Apache ECharts, Zod
- Status
- v1 demoed to the team twice; being simplified before rollout
- Data
- Synthetic in every screenshot and demo. The real records never leave a local machine
The problem
Plenty of activity. No results.
Insurance agencies grow through referral partners: realtors, loan officers and financial advisors who send them clients. Canyon State's reps visit those partners to keep the referrals coming, and every visit went into a shared spreadsheet with 38 columns, personal notes on each partner included.
The Director of Sales could see the activity, but not what it produced. Which partners send clients who actually buy? Which ones are going quiet? Is a rep's time going to the right places? The agency's CRM tracks clients through the sales pipeline, but it has no idea partners exist beyond a name typed on each client.
What it does
Who sends business that closes, and who's due a visit.
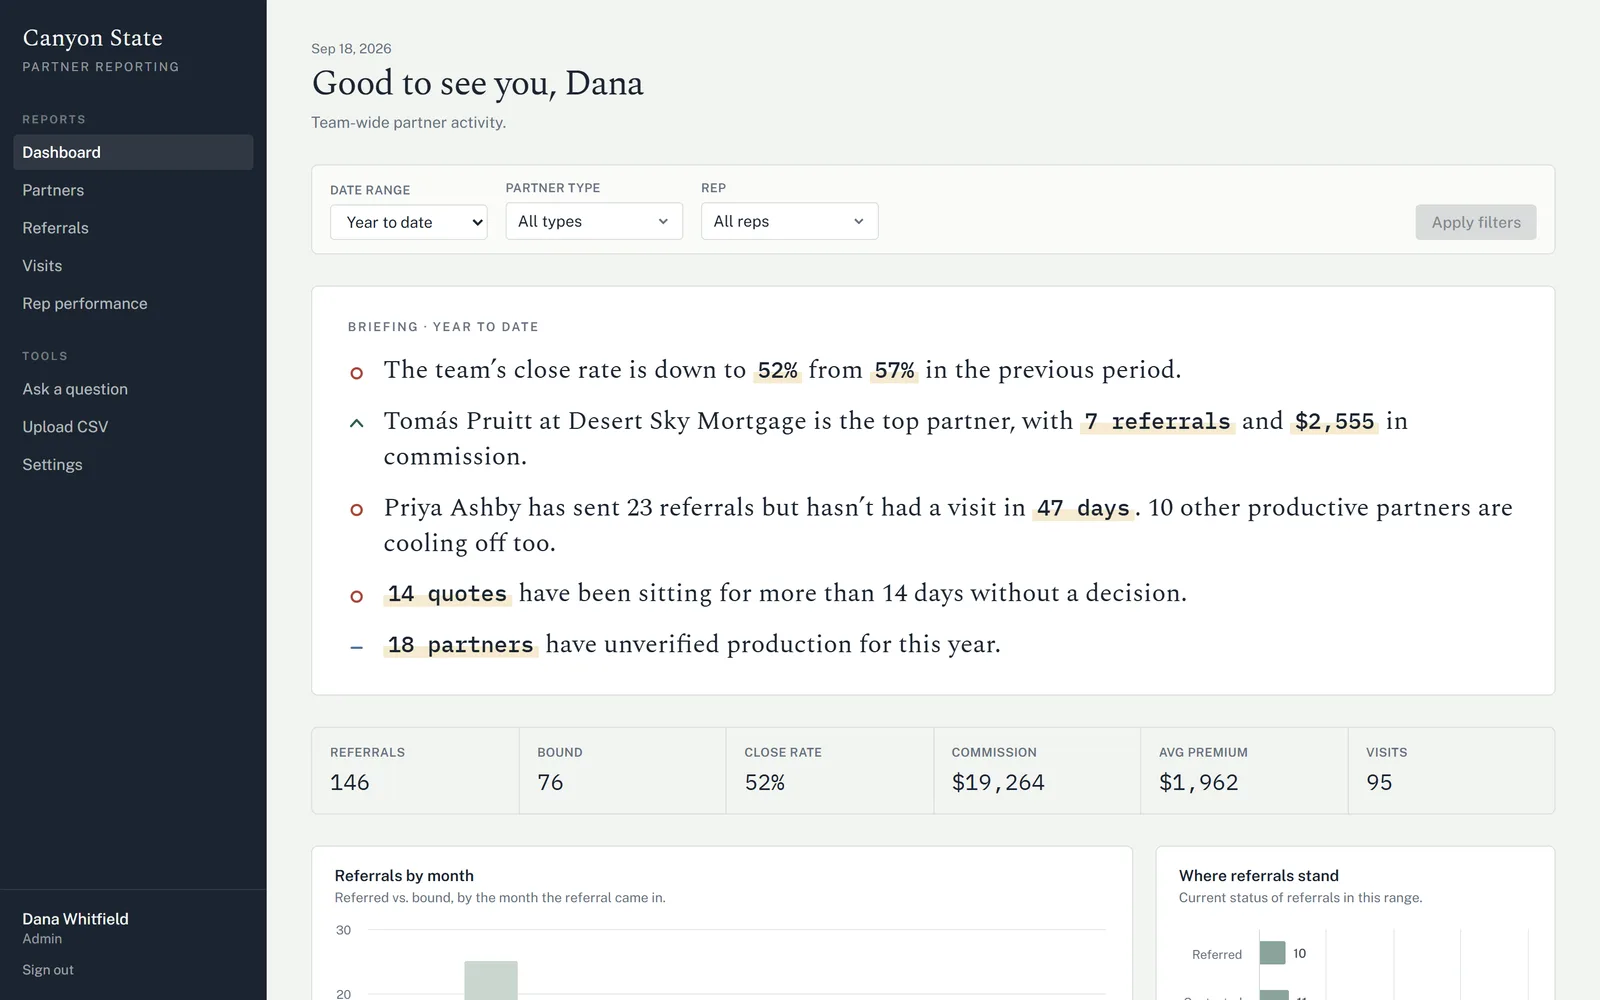
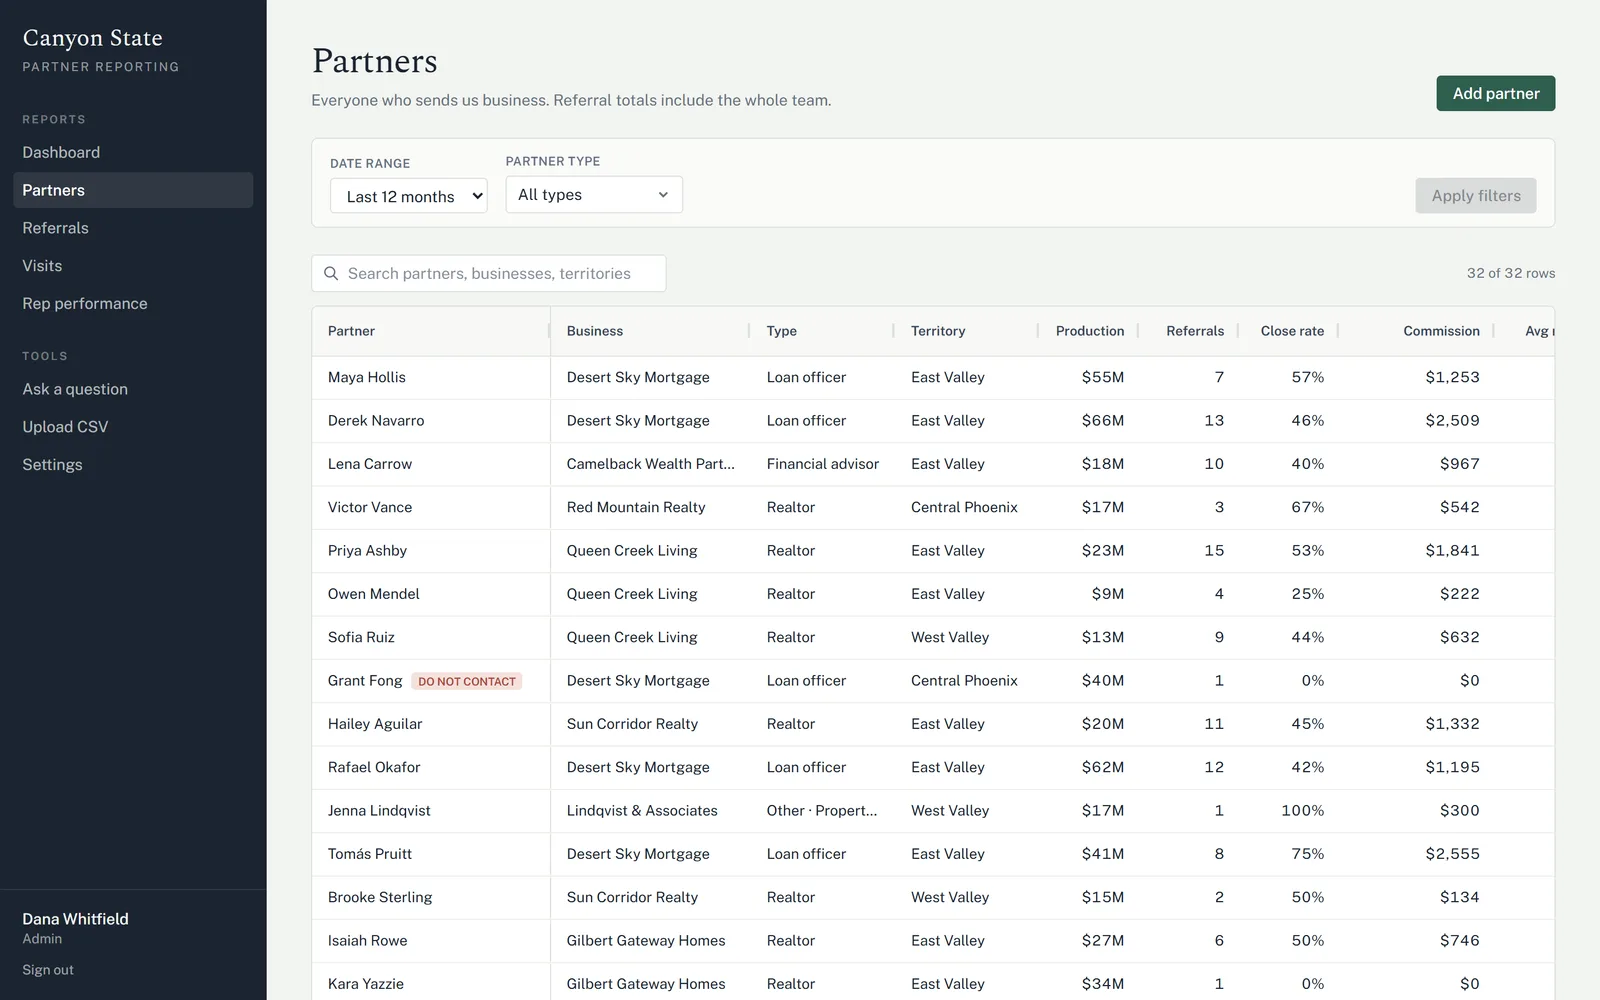
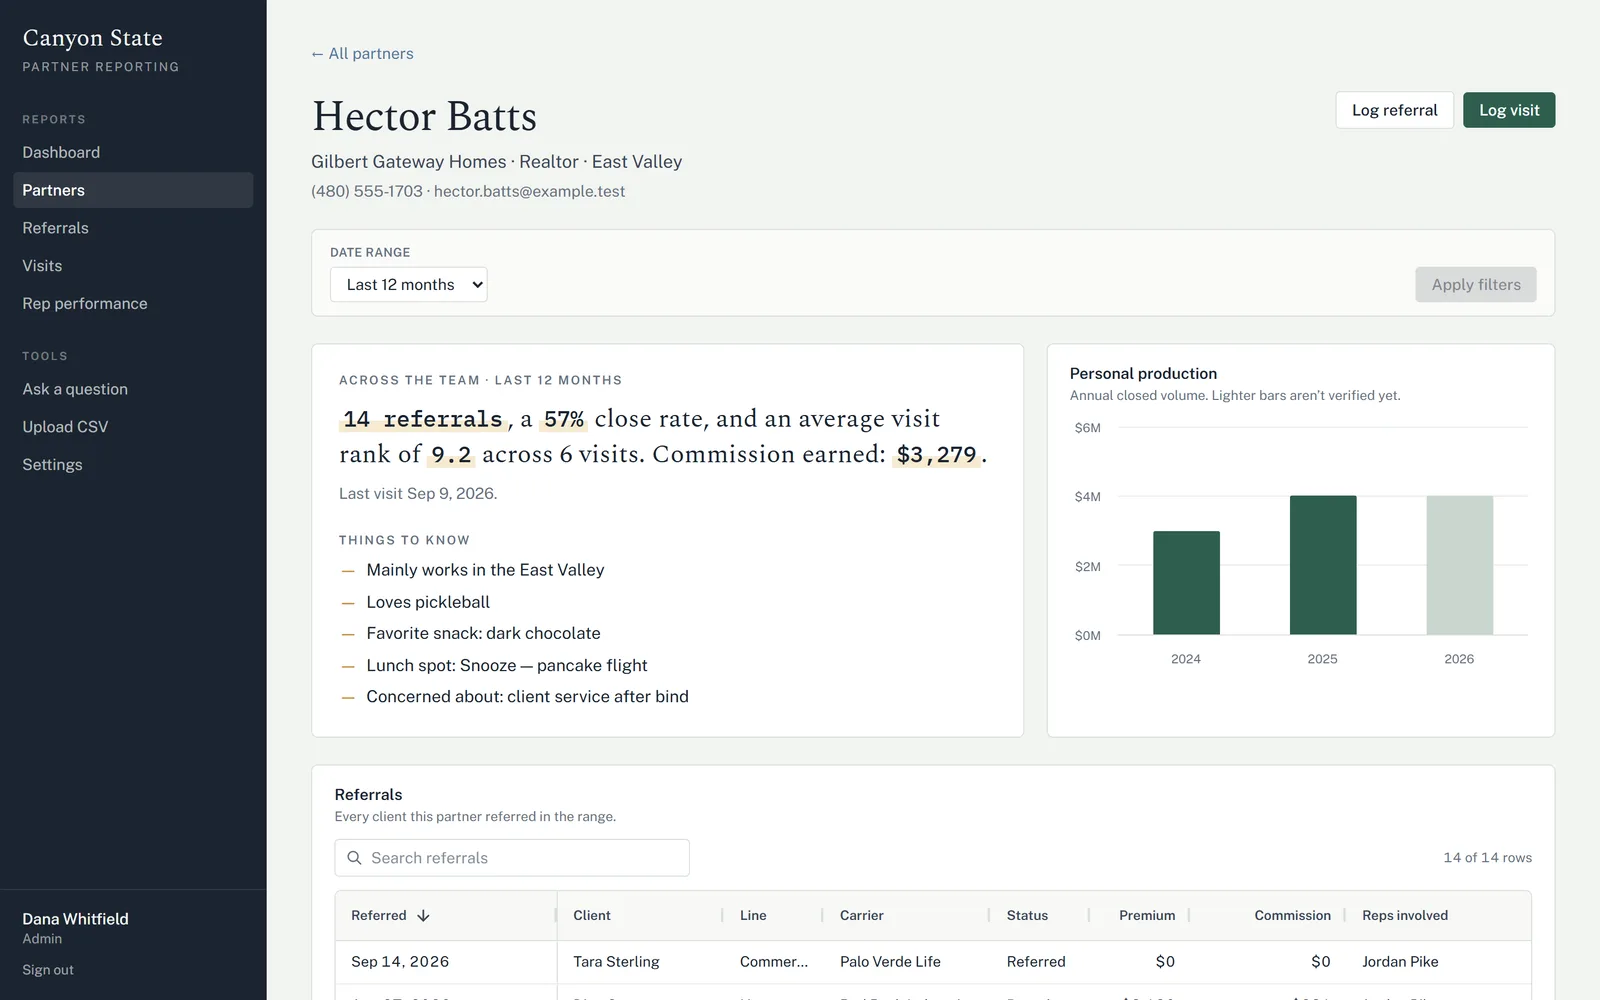
- Partners: referrals, close rate, commission and return on visits for every partner, compared with the previous period.
- Tiers and visit rhythm: partners are tiered by referrals a year (Whale, Marlin, Tuna, Guppy) and each tier has a rhythm. Past it, a partner is due; past it twice, going cold.
- Today: the first page a rep sees. Partners due or going cold, clients with no follow-up, and this week's goals.
- Weekly goals: replaces the team's goal sheet. The manager sets each rep's goals on Monday, reps tap +1 through the day, and the team grid shows pace for the sales meeting.
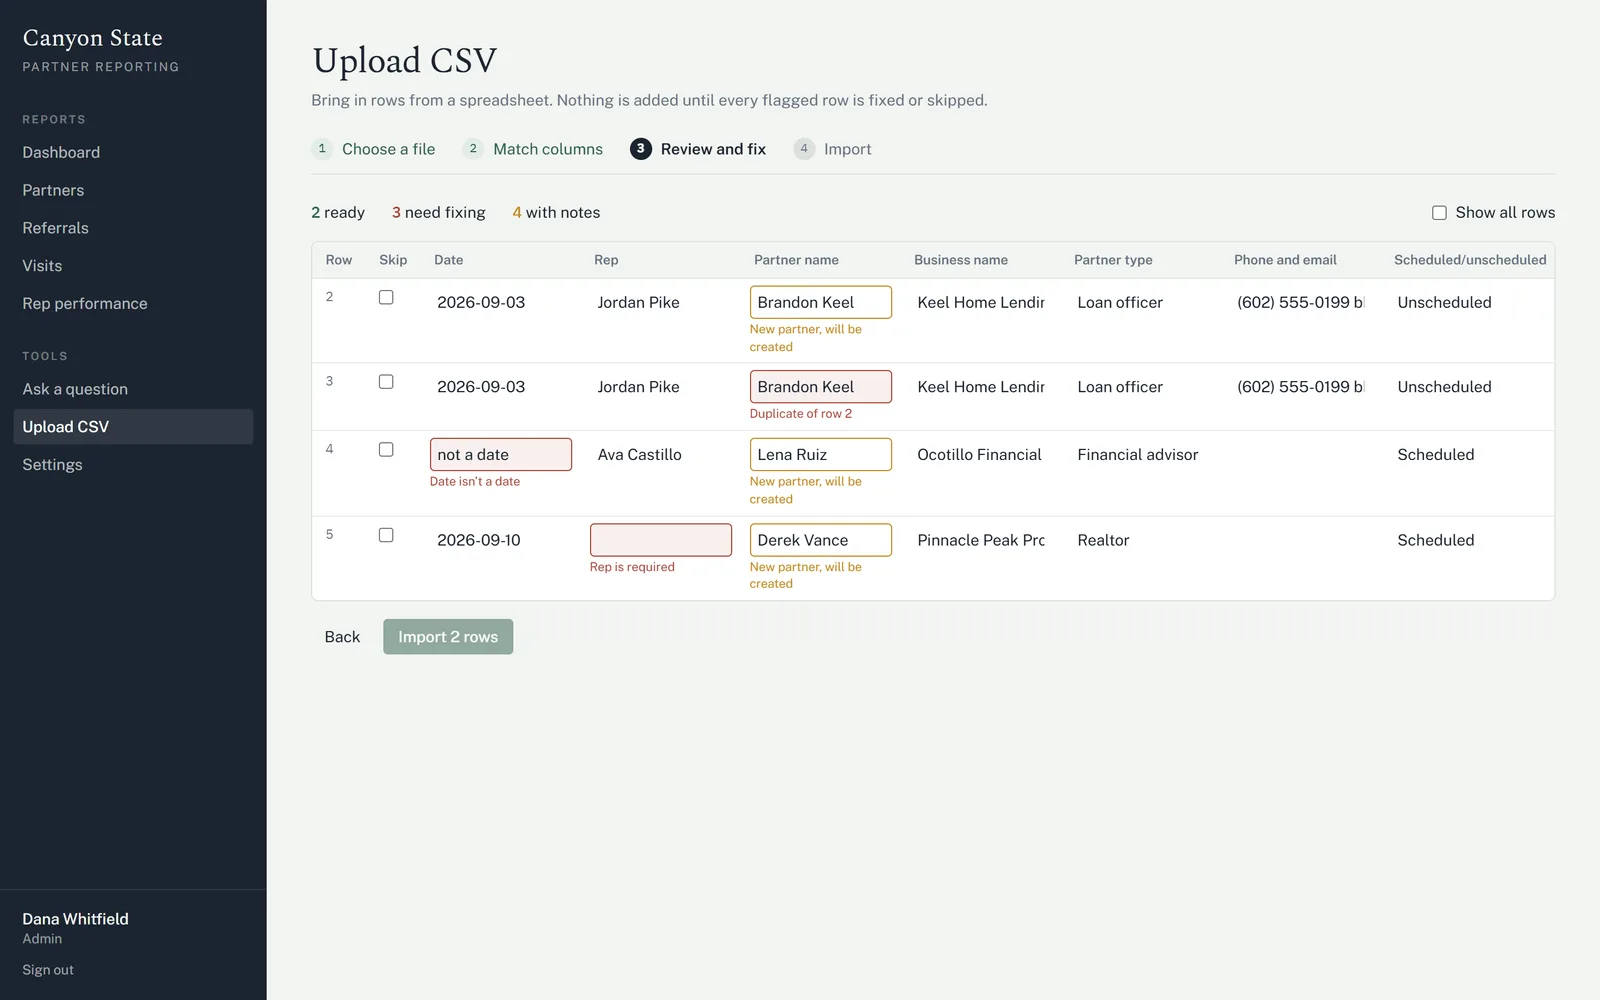
- Fast entry on a phone: reps log visits in the field, so adding a partner, visit or referral is one tap from any page, with a Ctrl+K command palette on desktop.
What I decided,
and what I rejected
Five calls, and what each one cost.
Call 01Multi-agency from the first commit
Agencies differ only through settings, never through if statements in the code. The easiest way to break that rule is to have only one agency to test against, so a second, fictional agency runs alongside Canyon State to keep it honest.
- Chose
- Each agency gets its own subdomain, branding, pick lists, tier names, time zone and feature switches, all as settings.
- Rejected
- A single-agency build, with the second customer handled later.
- The cost
- More configuration surface than one customer strictly needs on day one.
Call 02Access rules live in the API, never only in the UI
Reps see their own numbers; managers see everything. Another agency's record answers "not found", the same as an id that doesn't exist, so a guessed id tells you nothing. The tests sign in as agency A and ask for agency B's records, along with role access, masking, paging and response shapes.
Birthdays, addresses and personal notes are masked for anyone who isn't the record's owner or an admin, and they are never sent to AI features. Every shape is a Zod schema, and the business rules (tiers, rhythm, goals, period over period, masking) are pure functions the backend will reuse.
- Chose
- Every rule enforced behind a typed API contract, with 160+ contract tests run against the interface.
- Rejected
- Hiding buttons and columns in the front end and calling it access control.
- The cost
- v1 runs on an in-browser mock server that has to enforce the same rules the real backend will.
Call 03Real data never leaves the machine
A pre-commit check blocks any commit containing real names, and production builds can't load the data at all. Hooks stop AI tools from reading the private folder, too. The live preview uses two fictional agencies with eight fictional people each, and a fixed "today" so the numbers read the same on every visit.
- Chose
- The agency's records load only on a local dev server, from a git-ignored folder.
- Rejected
- A hosted demo on the real spreadsheet.
- The cost
- The public preview runs on synthetic data, and real-data demos run on a local machine.
Call 04Ask instead of guessing
I started in the office, learning the team's process, then built against their real spreadsheet locally: about 450 visits, 500 partners and 70 weeks of goals. A written decision log records every choice and why, by date.
- Chose
- Open business rules went on a call sheet of questions for the agency, each a labeled placeholder an admin can change until it's answered.
- Rejected
- Deciding for them what counts as “closed”, where the tier cutoffs sit, and who gets credit.
- The cost
- Some numbers ship with a visible placeholder rule behind them.
Call 05Ship v1, keep v2 as the exercise
I rebuilt the same product in Next.js, FastAPI, Postgres and Inngest to learn that stack properly on a real problem: a client generated from the OpenAPI schema, real sign-in with Argon2id and hashed session tokens, and an audit trail a database trigger keeps append-only.
The team saw both and preferred v1's simpler screens. That settled it.
- Chose
- The Vue 3 build as the product.
- Rejected
- My Next.js 16, FastAPI and Postgres 17 rebuild as the version the agency uses.
- The cost
- A complete second stack, with 313 pytest tests and Playwright runs in CI, that the agency won't use.
The demos
Too many features, said plainly.
The first demo added weekly goals, multi-policy referrals and a Personal / Commercial toggle across the app. The second, with an experienced agent, said plainly that it had too many features.
The team is choosing the core metrics now, and the app will be cut down to them before rollout. After that: a Node, Express and Postgres backend behind the same contract, then a read-only sync from the agency's CRM.